When discussions turn to Washington’s status as a net donor state, conversations often stall in political debate—arguing whether high-income states "should" subsidize other regions.
That misses the structural economic reality.
The critical issue facing Washington isn't about paying a "fair share." It is about macroeconomic capital extraction, broad fiscal drag, and compounding liquidity friction during an era of historic national deficit spending. To understand why Repatriate Washington tracks federal fiscal balance data, we must analyze the mechanical movement of capital and how removing liquidity creates a systemic drag across our entire economic engine.
1. The Numbers: A Massive Capital Shift
The chart below tracks Washington State's net federal fiscal balance (federal inflows minus net federal receipts) from Federal Fiscal Year 2020 through 2024:
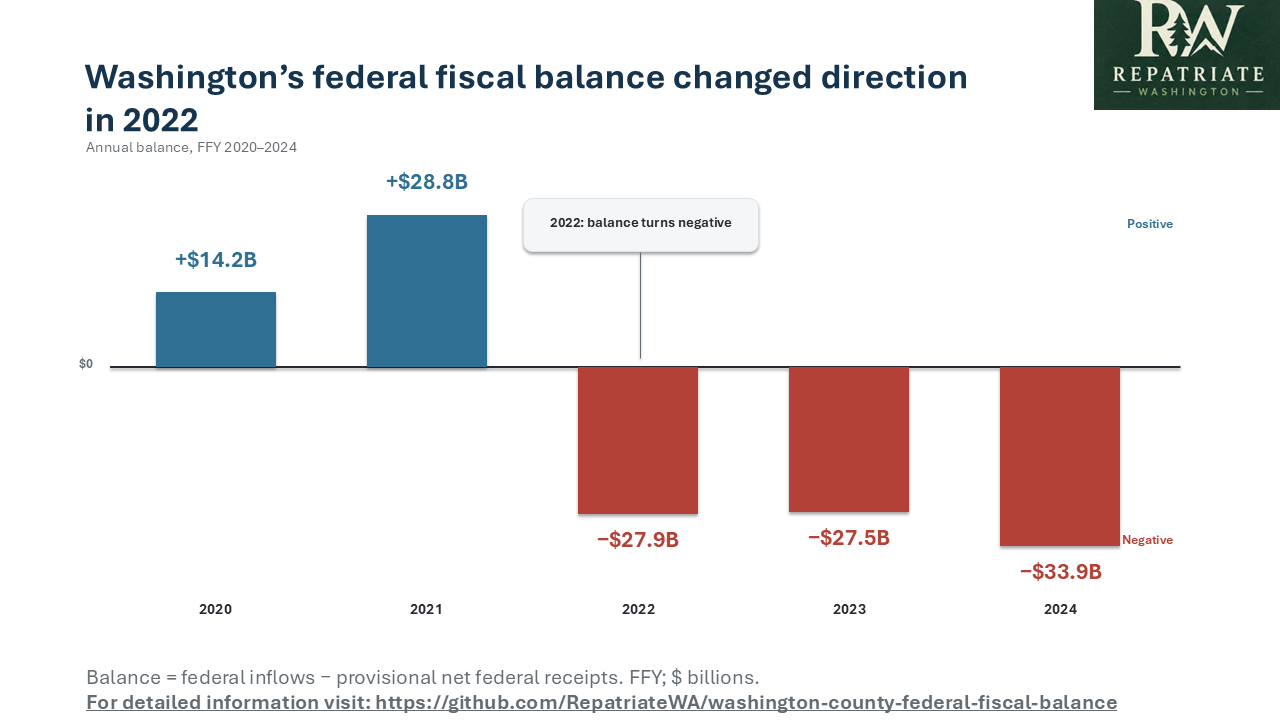
2020: +$14.2 Billion (Net Inflow)
2021: +$28.8 Billion (Peak Pandemic Relief Inflow)
2022: -$27.9 Billion (Reversion to Deficit)
2023: -$27.5 Billion
2024: -$33.9 Billion (Net Capital Outflow)
During emergency pandemic programs (2020–2021), federal stimulus injected liquidity into local businesses, households, and infrastructure. Once those temporary emergency mechanisms ended in 2022, Washington swung back into a steep net negative balance—extracting over $89 billion in capital from the state in three years alone.
2. Macroeconomic Context: Structural Drag During National Expansion
To understand the full impact of this -$33.9 billion net deficit, look at what the federal government is doing nationally.The federal government runs annual deficits approaching $2 trillion. In macroeconomic terms, a federal deficit is a net injection of fiscal liquidity into the private sector. Nationwide, Washington D.C. is spending roughly 20–30% more than it collects.Yet, despite this nationwide flood of liquidity, Washington State experiences an aggressive net fiscal contraction. While federal spending expands the overall national money supply, capital is pulled out of Washington’s regional economy and reallocated elsewhere.
Instead of riding the wave of national expansion, Washington's economy is forced to row against a persistent upstream fiscal current.
3. The Mechanics of Fiscal Drag: A Compounding Friction
The primary danger of a $33.9 billion net drain is not just the initial sum—it is the broad, compounding economic drag it creates across the state.
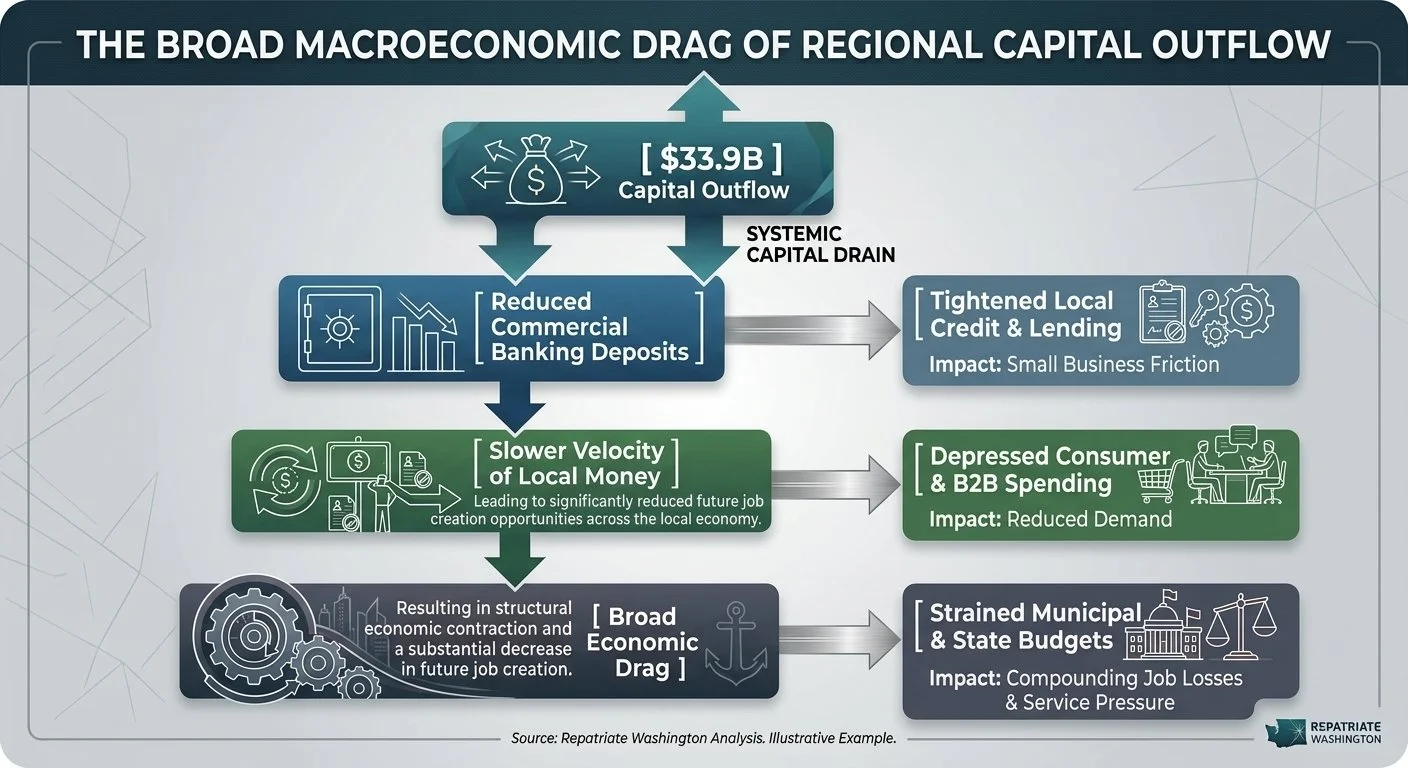
Capital retained locally circulates through commercial banks, payrolls, consumer spending, and business investment. When $33.9 billion is extracted in a single year, that circulation breaks down:
Deposit Extraction & Credit Tightening: Tax dollars sent to federal accounts leave local commercial financial institutions. Lower regional deposit bases reduce local bank lending capacity, driving up borrowing costs for local small businesses, home builders, and commercial ventures.
Loss of Money Velocity: Standard macroeconomic models estimate regional spending multipliers between 1.35x and 1.6x. Removing $33.9 billion in direct liquidity eliminates $45 billion to $54 billion in total local economic velocity every year.
Opportunity Cost in Jobs and Output: Based on regional employment multipliers, sustaining an annual drain of this scale creates an opportunity loss equivalent to 170,000 to 220,000 uncreated jobs and unbuilt expansion projects across the state.
4. How Broad Drag Manifests Across Sectors
This friction does not remain contained in macroeconomic models; it creates visible pressure across both the private and public spheres:
Private Sector Manifestation
Higher Cost of Growth Capital: Local firms face tighter credit conditions and higher interest rate spreads because capital is actively flowing out of the state rather than pooling in regional banks.
Compressed Retail & Service Demand: When billions of dollars leave consumer and corporate balance sheets without returning through federal payrolls or procurement, local consumer spending cools across retail, hospitality, and trade services.
Public Sector Manifestation
Downstream Municipal Squeezes: As broad private commerce slows under fiscal drag, state and city tax bases feel the pressure. Local governments—facing flat or declining sales tax revenues—are forced to raise local fees, levies, or property taxes to maintain basic services.
Infrastructure Deficits: Regional infrastructure (bridges, roads, water facilities) that should be upgraded with returned tax dollars is either deferred or funded by issuing municipal debt, placing long-term interest burdens on local taxpayers.
5. Why Tracking This Data Is Essential
Repatriate Washington tracks and publishes county-level and statewide federal flows because broad economic drag cannot be addressed until it is measured.
Tracking this data serves three main goals:
Quantifying Regional Drag: Providing civic leaders, business associations, and economists with clear data showing where capital is being drained and how it impacts regional growth.
Diagnosing Local Revenue Struggles: Helping local officials recognize that municipal budget pressures are often downstream symptoms of federal liquidity drain—not just local spending decisions.
Building a Foundation for Economic Balance: Establishing a transparent ledger so Washington can advocate for smarter federal procurement, targeted infrastructure reinvestment, and capital retention strategies.
The Path Forward
The goal is not to isolate Washington State from the federal system, but to ensure our state's economic engine is not continuously eroded by unmonitored capital extraction during a period of massive national expansion. By tracking, analyzing, and bringing transparency to these macroeconomic flows, Repatriate Washington works to safeguard our state's economic vitality and long-term autonomy. For interactive datasets, methodology documentation, and raw data files, visit our open data repository: github.com/RepatriateWA/washington-county-federal-fiscal-balance